
The global water crisis, and why it persists.
Billions of people still live without safe water at home. Behind that number sits a harder problem: even where water arrives, too much of it stops flowing within a few years.
What the water crisis looks like today.
Ten figures that map the crisis, from who lacks safe water, to what it costs in lives, time and lost learning. Each is drawn from current global monitoring.
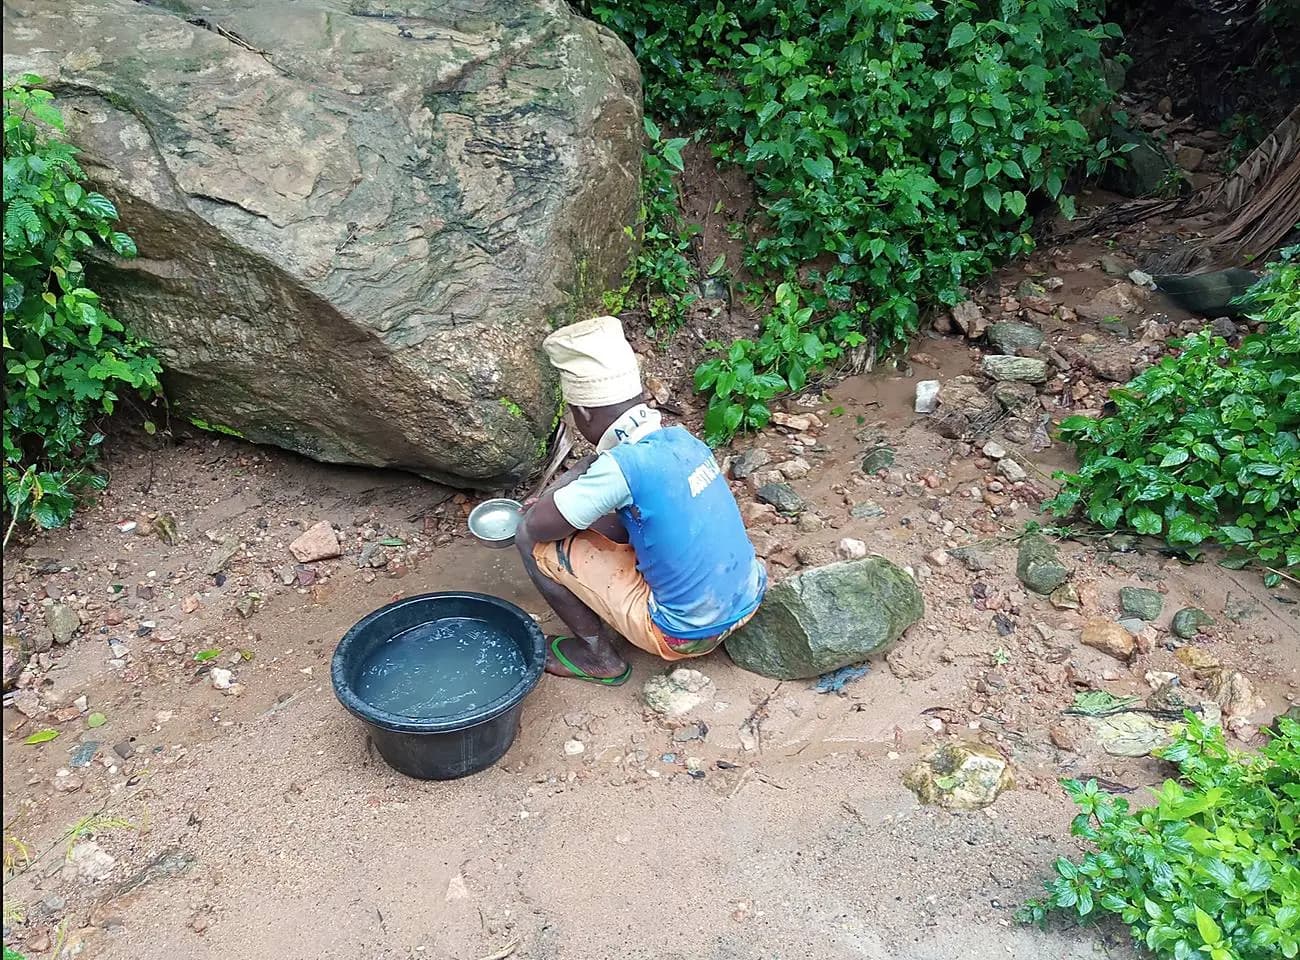
 Collecting water from an open source. Illustrative image.
people have no source of drinking water but a lake, a pond or a river.
Surface water is untreated and easily contaminated. For these communities, safe water is not a matter of convenience. It is the difference between an ordinary day and a preventable illness.
Unsafe water is one of the world's quietest killers.
Water related disease rarely makes headlines, yet it takes around 1.4 million lives every year, most from diarrhoea linked to unsafe water, sanitation and hygiene. The toll is heaviest on the youngest. And where water is far away, the hours spent fetching it fall mostly to women and girls, time taken from school, work and rest. The crisis is measured not only in litres, but in lives and lost potential.
Nearly 395,000 children under 5 die every year from a problem the world already knows how to solve.
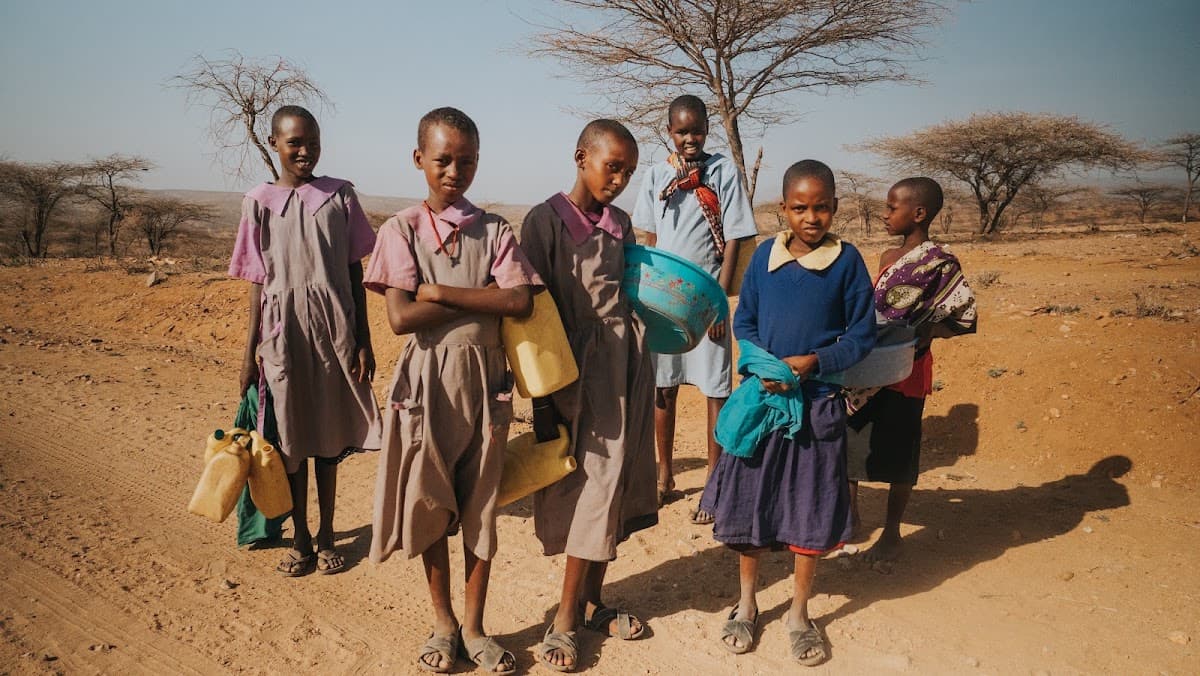 The daily walk for water. Illustrative image.
Water poverty is expensive. Solving it pays for itself.
The cost of doing nothing is measurable. Inadequate water and sanitation drain hundreds of billions from developing economies every year through lost time, lost productivity and higher health spending. The return runs the other way just as clearly. Safe water is not only a moral case. It is one of the highest return investments in development.
Billions have been spent ending water poverty. Too little has been spent making it last.
For decades, the water sector has measured success by how many water points get built. But building a water point and sustaining a water service are not the same thing. In the communities FairAction has mapped, around half of the water projects already built have failed, cutting people off from the safe water they were promised.
It is a pattern seen right across the sector. This is the sustainability gap: the distance between water delivered and water that keeps flowing. It is the reason the crisis has proved so stubborn, and it is the problem FairAction was built to close.
For wider context, across 20 sub-Saharan African countries studied, up to 36% of handpumps sit non-functional at any given time, with country rates ranging from 10% to 65%. Rural Water Supply Network.
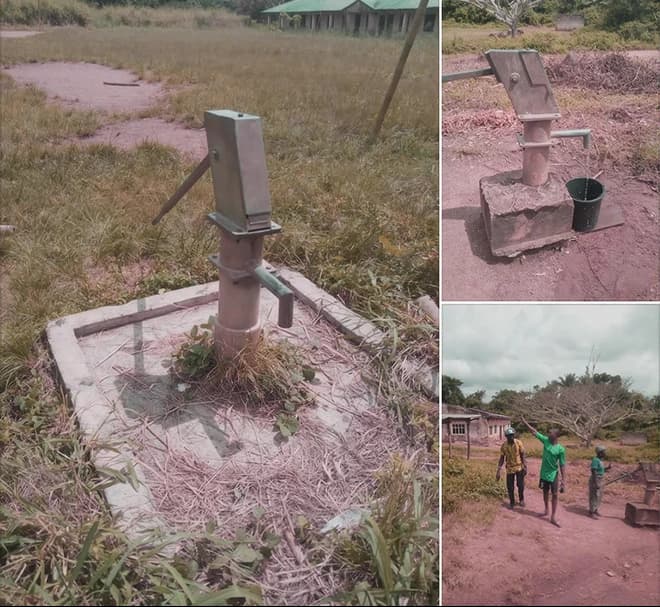
A water project that will not last can leave a community worse off than before it was built. That is why, if a project will not last, we will not build it.
We treat sustainability as the problem, not an afterthought.
FairAction is a research led water charity. Rather than adding another set of water points to the map, we study why they fail, and we design against every one of those failure points before a single pipe is laid. That research feeds back into everything we do, from designing water systems that keep flowing long after handover, to building our capacity to support others to do the same. It is how we work toward clean water for all, built to last.
Safe water is only real if it is still there tomorrow. That is fair action.
Common questions
Around 1 in 4 people worldwide, roughly 2.1 billion, still lack safely managed drinking water at home. It is the baseline of the crisis, and in many places progress has stalled.Source.
WHO / UNICEF JMP
For decades, success was measured by how many water points were built, not by whether they kept working. Building a water point and sustaining a water service are not the same thing, and without funding, spare parts and local management, many stop flowing within a few years.
It is the distance between water delivered and water that keeps flowing. A project can be built, celebrated, and then break down, cutting a community off from the safe water it was promised. Closing that gap is the problem Fairaction was built to solve.
UN Sustainable Development Goal 6.1 is the global commitment to safe and affordable drinking water for all. Access is not achieved when infrastructure is installed. It is achieved when water is safe, reliable, affordable, and still working over time.
Rather than adding more water points to the map, Fairaction studies why they fail and designs against each failure point before building. The principle is simple: if a project will not last, we will not build it.
References
- WHO / UNICEF Joint Monitoring Programme, Progress on household drinking water, sanitation and hygiene 2000 to 2024: special focus on inequalities (2025). washdata.org/reports/jmp-2025-wash-households
- WHO, Drinking-water fact sheet (13 September 2023). who.int/news-room/fact-sheets/detail/drinking-water
- WHO, Water, sanitation and hygiene: burden of disease. who.int/data/gho water, sanitation and hygiene burden of disease
- WHO / UNICEF JMP, Progress on household drinking water, sanitation and hygiene 2000 to 2022: special focus on gender (2023). who.int news, women and girls bear brunt of the water and sanitation crisis
- WHO, Drinking-water fact sheet (13 September 2023). who.int/news-room/fact-sheets/detail/drinking-water
- WHO / UNICEF JMP, WASH in schools, 2023 data. data.unicef.org WASH in schools
- WHO / UNICEF JMP, WASH in health care facilities, 2023 data update. washdata.org/reports/jmp-2024-wash-hcf
- World Bank / Water and Sanitation Program, economic impacts of inadequate sanitation and water supply (2012 to 2013). worldbank.org, US$260 billion a year in global economic losses
- WHO, Global costs and benefits of drinking-water supply and sanitation interventions (2012); return on investment reported via UN News. news.un.org/en/story/2014/11/484032
- Rural Water Supply Network, handpump functionality analysis across sub-Saharan Africa. rwsn.blog, the presence of a handpump