
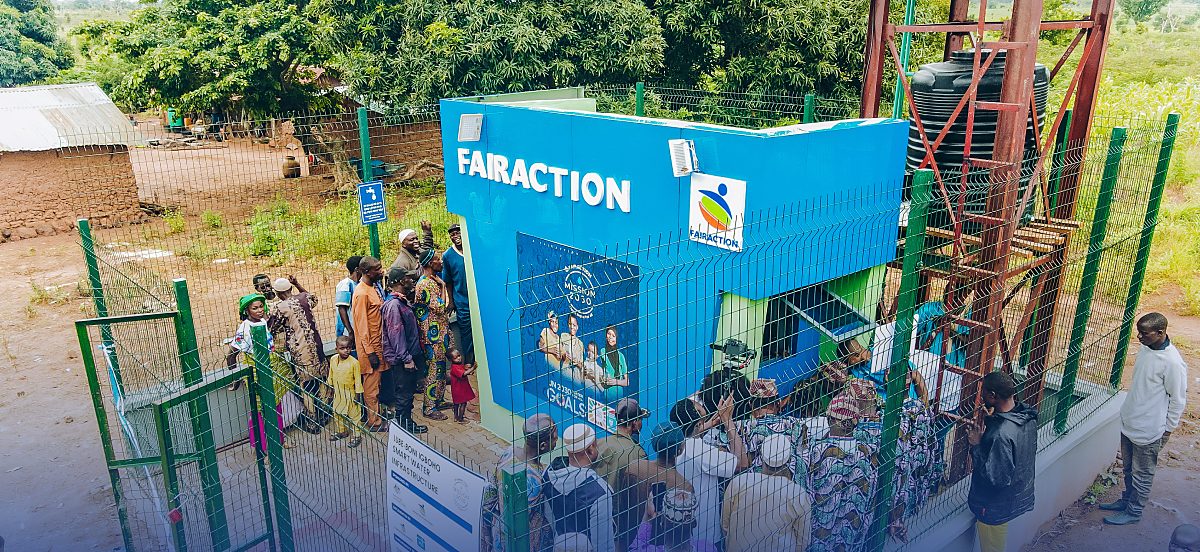
Fairaction specialises in water sustainability. We build the knowledge of how water solutions fail and what keeps them working into a framework the water sector can adopt and adapt, so that sustainable implementation becomes the norm and clean water for all becomes achievable.
That knowledge is expensive to build. Before construction, extensive diagnostic research determines what to build, where to build it, and what kind of solution each community actually needs, because water is never one size fits all. After construction, years of longitudinal data collection and analysis verify what works and what fails. Pre-construction and post-construction: the two phases that make construction succeed, and the two phases the sector rarely funds.
Donors reward the build, and the emotional video of people being served. So the sector counts builds and communities reached, while the metrics SDG 6.1 actually requires, safe, affordable, reliable water over time, are rarely counted.[7]
More than 95% of our work builds this knowledge. But for nine years, to compete for funding in a sector that counts builds, we told our story through the less than 5% that is construction. In July 2026, that ended. Our new website is live at fairaction.ngo. For the first time, we lead with the biggest work we do: research and knowledge creation, condensed into a sustainability framework, so that when it is funded, we and others across the sector can build water solutions that last.
- What our old website failed to achieve, and how following the sector's best advice led us there
- What the knowledge actually costs, shown through mapping work whose price could have built 50 easy-to-count water points
- How counting builds became one of the sector's biggest sustainability challenges, and why we do not blame the sector for it
- The mindset shift systems thinking calls the strongest lever, and why designing for sustainability requires it, explained through our own website change, which is at heart a change of information
Our old website did its job well. That was the problem.
It looked like a water charity is expected to look. A crisis statistic in the headline, a banner with happy kids, and an appeal for donations.
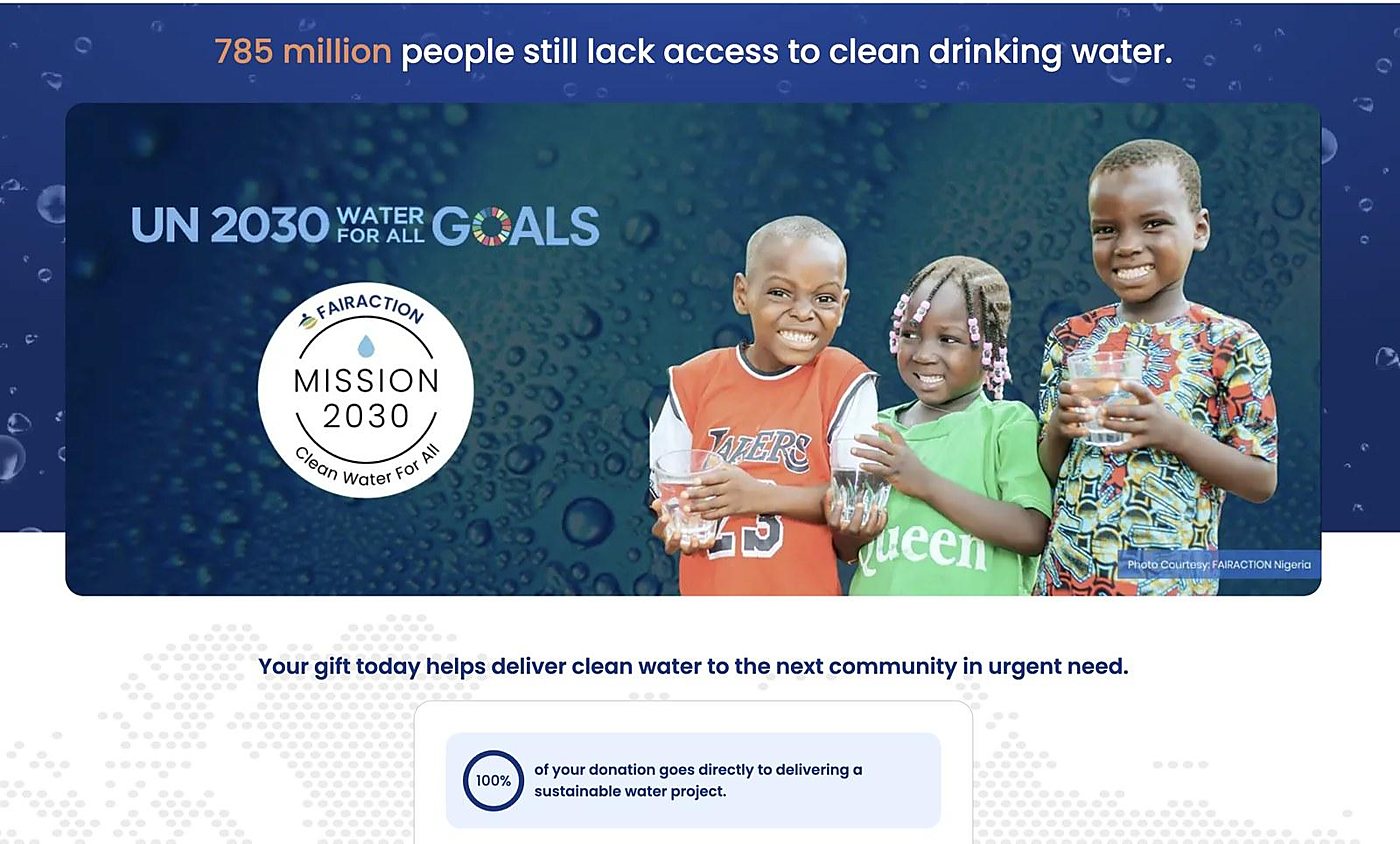
We built it because we believed it was best practice, and everything around us confirmed that belief. Every consultant we engaged, professionals with genuine expertise in charity communications, advised the same traditional approach. Donors recognise it. Platforms rank it. When the entire ecosystem, including the people you pay for advice, points to one template, following it does not feel like a choice. It feels like competence.
But the template told the wrong story about us. It presented Fairaction as an organisation that mainly installs water projects, to be measured by how many it builds. And installation has never been what Fairaction is.
What the old website failed to achieve
Looking back honestly, the old website failed at six things.
It failed to say what we actually are
Nearly everything we do is research and systems: diagnosing why water projects fail, building the frameworks and monitoring that make them last. The website showed almost none of it.
It failed to show the knowledge
Six peer-reviewed publications. 265 sustainability challenges systematically catalogued across six root causes.[1] A predictive diagnostic model that tells us what each community needs before anything is built. On the old site, this body of work was nearly invisible.
It failed to present our projects as evidence
Every Fairaction smart water site is a live research installation, reporting its own functionality, water quality, finances, and use, every day, for years. The old site showed them as photo stories, indistinguishable from the projects of NGOs that mainly install water points. A photo story and a longitudinal dataset are not the same thing.
It failed to distinguish mapping from serving
We presented our 1,700+ mapped communities as a queue waiting for donations. In reality, that mapping is the diagnostic foundation of everything we build. It tells us where water fails, why it fails, and what would make it last.
It failed to give serious funders a way in
The site asked individuals to fund projects. It gave institutional foundations, governments, and researchers no way to fund the model itself: the research, the monitoring, the tools the sector can adopt.
It failed to state our rule
If a water project will not last, we will not build it. That sentence defines every decision we make, and the old website never said it.
Every build is a pilot
To understand why our story was so hard to tell in the sector's language, you have to understand how a Fairaction project actually works.
Every Fairaction build is a pilot, designed to test a hypothesis. Pre-construction is where the decisions that matter most are made: what to build, where to build it, and which solution fits this community's water resource, real demand, governance, and economics. There is no one-size-fits-all water project, and treating communities as if there were is one of the quiet reasons so many water points fail. So before we install anything, our research has produced a specific, evidence-based prediction: that this design, in this community, under these governance and financial arrangements, will still be delivering safe water in twenty years. The build exists to test that hypothesis. The monitoring exists to verify it, metric by metric, year after year. That is why every system reports its performance live: a pilot that cannot be measured proves nothing.
Diagnose and predict
Mapping, household interviews, water resource and demand assessment, governance and economics. The output is a hypothesis: this design, here, will still deliver safe water in twenty years.
Build the pilot
The part the sector photographs and counts.
Verify, year after year
Every system reports functionality, water quality, finances and use live. The hypothesis is tested metric by metric, and the findings feed the next pilot.
We work this way because, when we began, no piloted framework for sustainable water solutions existed. The literature held plenty of evidence about what should work, but almost none of it had been tested in the field. Most studies relied on secondary data, and the primary data needed to test specific hypotheses simply did not exist. Somebody had to collect it, community by community, system by system, year by year. That kind of work is expensive. And selling a hypothesis to a donor makes no sense in a sector that pays for finished water points.
And the work that comes before the hypothesis is enormous.
What the knowledge actually costs
Take our first major diagnostic. Mapping more than 1,700 communities across three states, with GPS and household interviews, cost significantly more than what 50 conventional water points would have cost to build. Fifty installations would have been photographed and counted, and we would have reported the end users based on the number of people each solution was intended to serve, with no post-construction metrics tracking whether anyone actually used them.
Our peer-reviewed research on underutilisation shows what that counting hides. An infrastructure built to serve a village of 1,000 people does not mean 1,000 lives changed. In some communities, a water solution ends up used by as little as 5% of its intended users, for reasons that should have been identified at the pre-construction stage and were not.[3] Counting infrastructure and its intended beneficiaries is not an accurate metric for impact.
Which brings us back to the choice we made. The 1,700-community mapping produced no countable build at all. What it produced was the evidence base: the finding that nearly half the communities had no improved water source, that half of those with infrastructure were living with broken systems, and the community-by-community understanding of why. Everything we have built since stands on this diagnostic mapping. It provides the foundation for our Predictive Iterative Sustainability Model methodology, which evaluates the 265 sustainability challenges we uncovered through our diagnostic work and systematic literature review.[1] And its data feeds the Target 6.1 Map, the digital system that turns the evidence into action: mapping water poverty, predicting a project's sustainability before construction, and monitoring every system live after it.
We have just concluded the next generation of that work. Our new state-level mapping in Oyo State, developed with input from WaterAid Nigeria, the Development Agenda for Western Nigeria (DAWN) Commission, and the Oyo State Ministry of Water Resources, has mapped 2,020 communities and evaluated 6,352 public water sources across 11 Local Government Areas. A team of 22 graduate field researchers, selected from more than 200 applicants, delivered months of continuous field operations, capturing 195 to 383 structured data fields per community across five nested levels: community profile, water source register, household perception, media record, and a supervisor-validated SDG 6.1 verdict, with embedded taxonomies and decision rules.
At that dimensionality, the dataset reaches a structural scale in the order of 390,000 to 770,000 data points across the communities mapped to date. This is the kind of dimensionality and consistency that makes machine-learning and predictive modelling feasible. A structured, multi-dimensional, community-level dataset of this kind is a research asset whose value extends well beyond a single selection exercise.
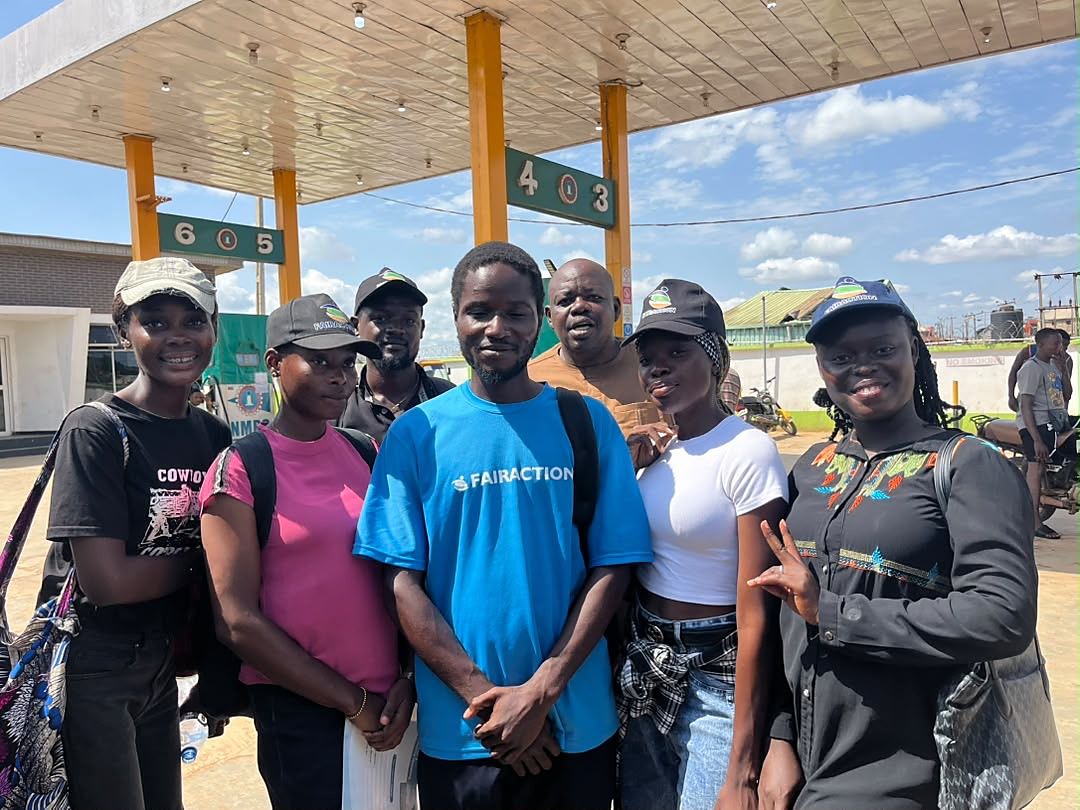
The work has been submitted for independent market valuation, and the numbers are in. The field implementation alone was assessed at A$547,400 for the first 977 communities: about A$560, at commercial rates, to map a single community properly. Extrapolated across all 2,020 communities mapped, the field work represents around A$1.13 million of research delivery. Add the separately valued methodology and instrument development stage, assessed at A$275,000 to A$305,000, and this one mapping programme stands at roughly A$1.4 million of independently valued knowledge work.
That is the price of the evidence. It could have been spent on water points that would have been easy to count. We chose the knowledge, again. Because 50 more water points, built without it, would simply have joined the statistics that follow.
How counting builds became a sustainability challenge
In my last article, I showed what happens when a system optimises for the wrong goal. The sector made infrastructure delivery its goal, so infrastructure delivery is what it produces. Goodhart's law does the rest: when a measure becomes a target, it stops being a good measure.[5] Installation was only ever a stand-in for water. The sector turned the stand-in into the goal.
What that article traced at project level, this one confirms at organisational level, because the counting culture does not just misdirect projects. It structurally starves the knowledge that sustainability depends on.
Three ways the counting culture starves the knowledge.
So infrastructure lands in the wrong places, duplicates what exists, and triggers aid overlap, which we documented and published in the IWA journal AQUA.[2]
So failures are invisible, unrepaired, and unlearned from.
So every organisation presents itself as an installer to survive, and the sector's collective effort flows into construction stripped of the knowledge that makes construction succeed.
The results are on the record. A sector measuring builds gets builds, while the water quietly stops.
This is not bad luck. It is a sector measuring builds and getting builds, while the water quietly stops.
And broken water is not a neutral outcome. This is the part the counting culture never sees: an unsustainable water project can cause more harm than good. It is the reason our rule exists.
If a water project will not last, we will not build it.
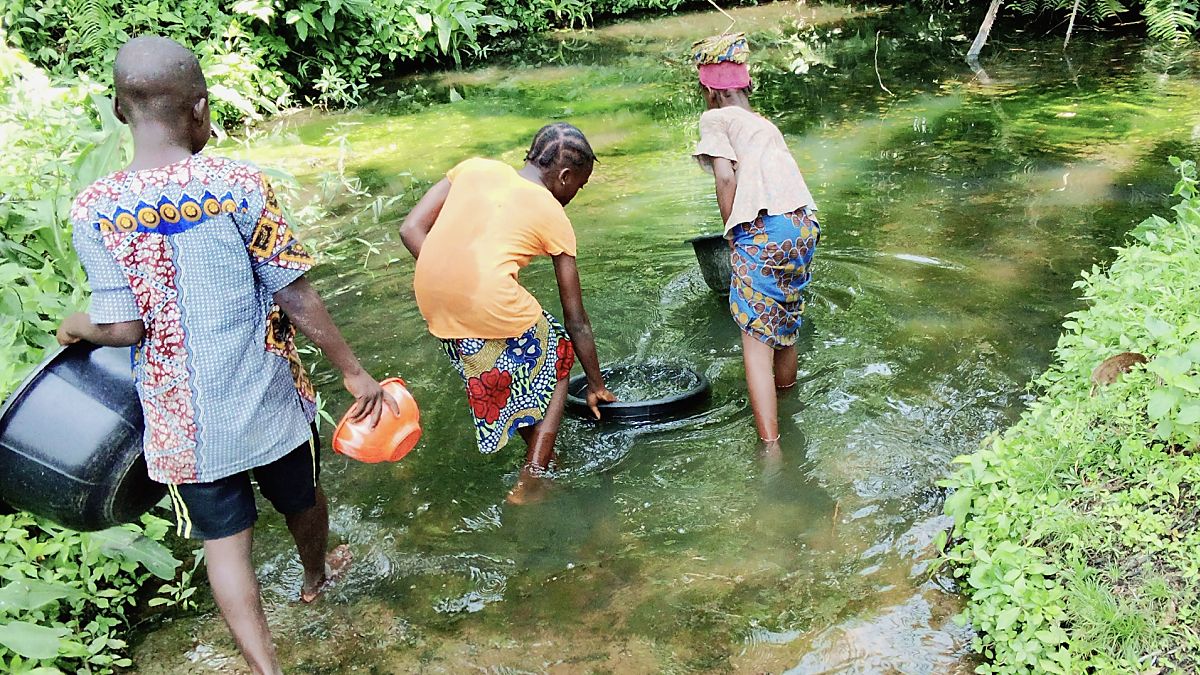
Bara community is our documented case. While a water point works, the old alternative, a distant, contaminated stream, is abandoned and grows more dangerous with neglect. When the water point fails, people do not return to what they knew. They return to something worse. Women and girls walk for hours again. Children drink water that is no longer safe. People get sick, and some die. A failed water project does not take a community back to where it started. It takes them below it. The full case is documented in the Fairaction Model.[8]
Are we blaming the sector?
No. If anyone is to blame, it is us.
When you are a young organisation, it is the norm to look at what the sector is doing and replicate it. Established organisations raise funds this way. Consultants advise this way. Every available template says: this is how it is done. Copying what appears to work is not a failure of judgement. It is how every young organisation starts, in every sector.
Maturity is something else. Maturity is when you have watched your own evidence long enough to know what works and what does not, and you back your evidence over the template. That maturity took us more than nine years to reach. Nine years of mapping, building, monitoring, publishing, and watching our own results diverge, year after year, from the story the sector told about how this work should be done and how it should be measured.
This article is not an accusation. It is a record of growing up.
The sector's practices did not fail us. We simply took nine years to gather the evidence, and the confidence, to stop following them where they no longer fit what we had learned.
What the new website does differently
The new website is our correction. It tells the whole story, in proportion.
The first words under our logo now read: a research-led water charity. The homepage opens not with a crisis statistic but with our specialisation: we specialise in water sustainability. We build the knowledge of why water projects fail and what keeps water flowing, so communities get reliable water, and the water sector gets a model it can adopt and adapt.
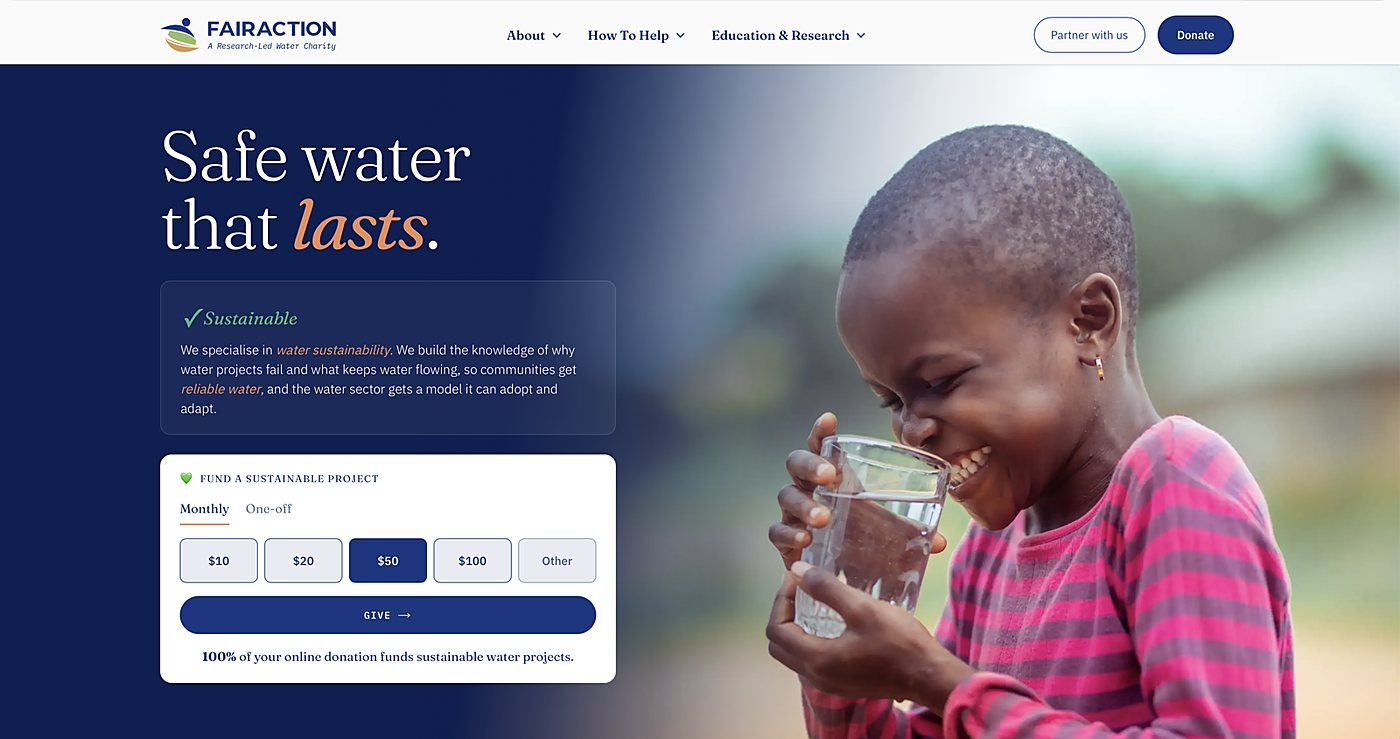
The numbers on our homepage changed too, and the change is the point. We no longer lead with counts of infrastructure. We report the metrics that describe what we actually do.
Beyond the homepage, the research now has its own home, with the publications, the Sustainability Framework, and the diagnostic model in full view. Every project is presented with its live sustainability record, which anyone can open on the Target 6.1 Map and inspect for themselves. And the partnership pathway now matches the work. Institutional funders are invited into multi-year support for sustainable service, monitoring, and innovation, not only project sponsorship, with the full evidence base open for them to examine before they commit a dollar.
The shift this is really about
In Thinking in Systems, Donella Meadows ranked the places to intervene in a system. Near the very top, above budgets, above rules, above even the system's goals, sits the paradigm: the shared mindset out of which the goals, rules, and metrics arise.[6] Change the paradigm, and everything downstream changes with it. And one of the few tools that can shift a paradigm, Meadows argued, is accurate information, placed persistently in front of the people whose minds must change.
- 01The paradigm: the mindset the goals, rules and metrics arise from
- 02The goals of the system
- 03The rules of the system
- 04Budgets, parameters, numbers
That is the shift the water sector needs. Not more installations, but a changed mindset about what water access is: a service sustained over decades, not an asset delivered on a day.
The sustainability challenge will not be overcome, for the communities served or for organisations' own capacity and funding, while the sector's paradigm rewards the build and ignores what makes the build last.
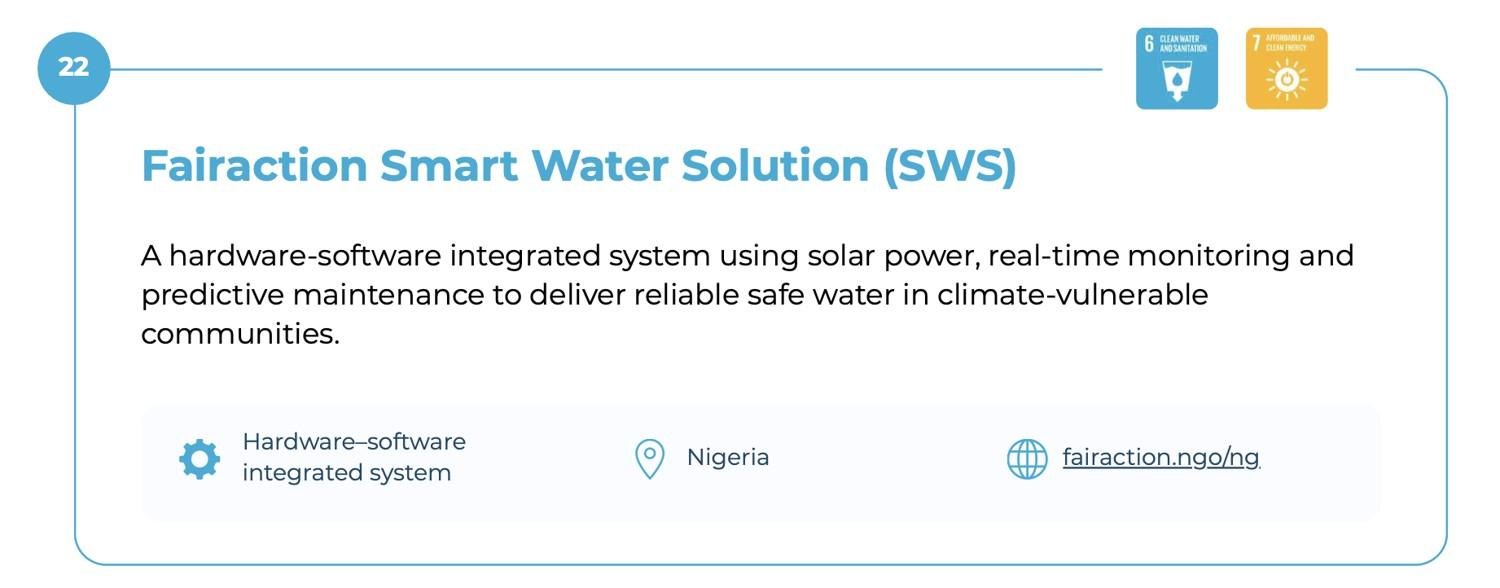
Our new website is our contribution of accurate information to that shift. You do not always have to be like everyone. Our Smart Water Solution is now recognised in the United Nations 2026 Solutions Book, one of 50 innovations selected from more than 900 submissions to a global call co-convened by the UN Department of Economic and Social Affairs, recognition that came from the knowledge work, not from an installation count.
Our reframing explains, clearly and in public, why our recent state-wide mapping is justified over installing 50 new conventional water projects: because without the knowledge, those 50 projects would in time join the 38% that stand broken.[4] Donors who understand the sector will now see exactly why this work deserves funding. That is the mindset shift we are asking our corner of the sector to consider.
Why this blog is called Designing for Sustainability
That shift is also why this blog is called Designing for Sustainability. Water that lasts is not installed. It is designed before construction and verified long after it, and every article here makes that case with theory and field evidence, one argument at a time. If this article changed how you think about counting water projects, share it with someone who funds, builds, or studies water.
Water that lasts is not installed. It is designed.
Theory and field evidence on what makes water solutions last, one argument at a time. Explore the new website at fairaction.ngo.
References
- 1Adeoti, O. S., Kandasamy, J. & Vigneswaran, S. (2024). Water infrastructure sustainability challenge in Nigeria: a detailed examination of infrastructure failures and potential solutions. Water Supply 24(6), 2066–2076. doi.org/10.2166/ws.2024.127
- 2Adeoti, O. S., Haremi, R., Kandasamy, J. & Vigneswaran, S. (2025). Evaluating the effectiveness of smart water management systems in enhancing the resilience and sustainability of water infrastructure in Nigeria. AQUA 74(2), 253–266. doi.org/10.2166/aqua.2025.291
- 3Adeoti, O. S., Kandasamy, J. & Vigneswaran, S. (2025). Diagnosing water infrastructure underutilization: a planning framework for behavioral risk, smart monitoring, and SDG 6.1 alignment. Water Supply. doi.org/10.2166/ws.2025.088
- 4Andres, L., Chellaraj, G., Dasgupta, B., Grabinsky, J. & Joseph, G. (2018). Why are so many water points in Nigeria non-functional? An empirical analysis of contributing factors. World Bank Policy Research Working Paper 8388. documents.worldbank.org
- 5Goodhart, C. A. E. (1975). Problems of monetary management: the UK experience. Papers in Monetary Economics, Reserve Bank of Australia.
- 6Meadows, D. H. (2008). Thinking in Systems: A Primer. Chelsea Green Publishing.
- 7United Nations (2015). Sustainable Development Goal 6, Target 6.1. sdgs.un.org; WHO/UNICEF Joint Monitoring Programme (2017). Safely managed drinking water. washdata.org
- 8Fairaction International. The Fairaction Model. fairaction.ngo/about/the-fairaction-model
- 9Rural Water Supply Network (2010). Myths of the Rural Water Supply Sector. RWSN Perspectives No. 4, St Gallen. ircwash.org (PDF)
- 10Foster, T., Furey, S., Banks, B. & Willetts, J. (2019). Functionality of handpump water supplies: a review of data from sub-Saharan Africa and the Asia-Pacific region. International Journal of Water Resources Development. doi.org/10.1080/07900627.2018.1543117