
When the same failure repeats for decades, the system producing it has to change, and one of the strongest levers of system change is a paradigm shift. The move to a new paradigm may depend on the next generation of leaders learning, before they lead, what makes a solution last.
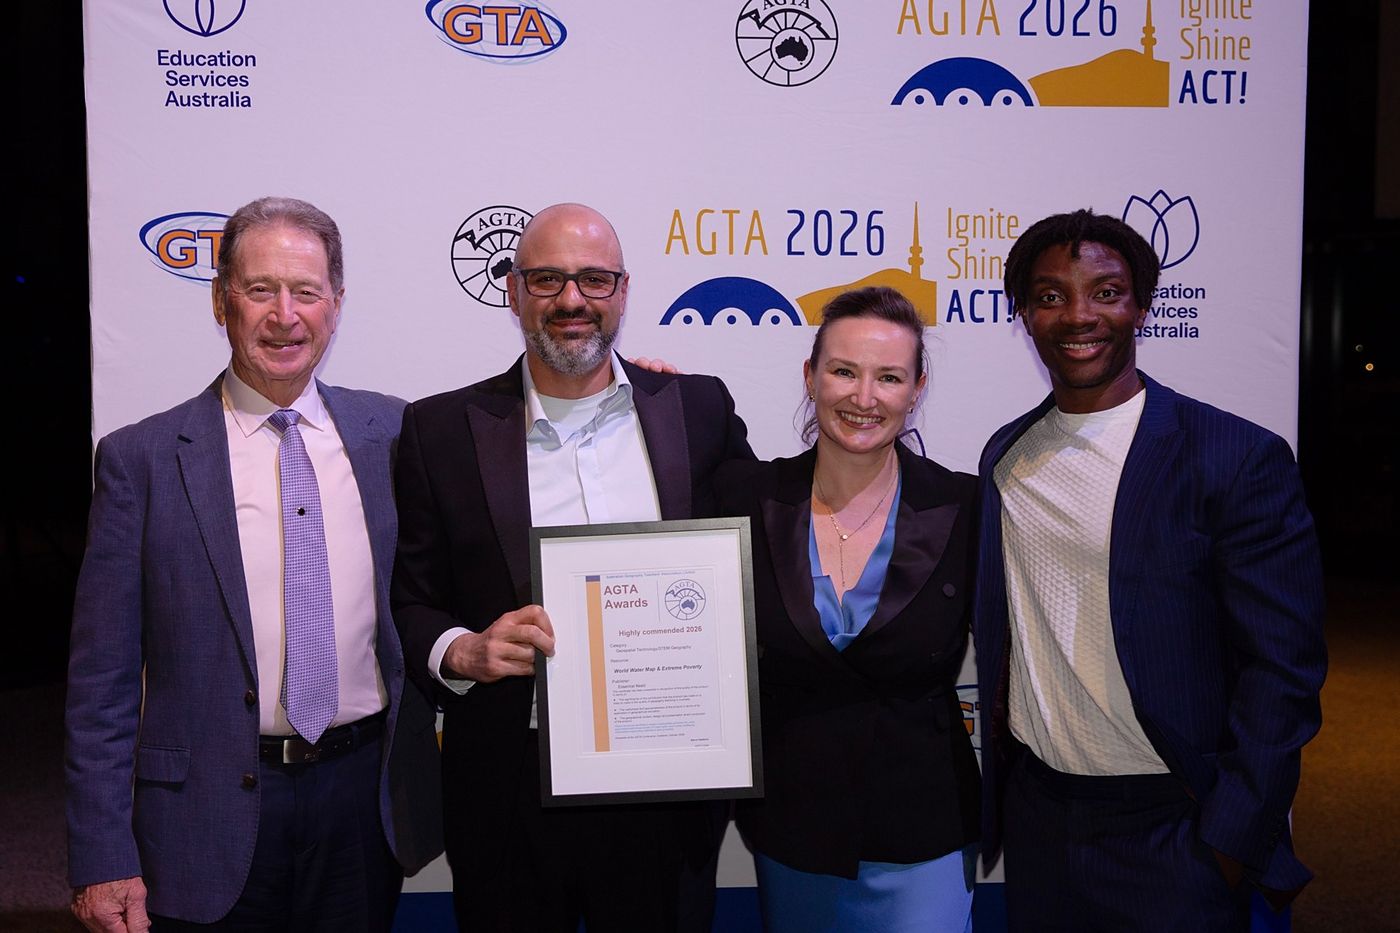
Earlier this month I was in Canberra with Rez Haremi, Yana Parsi and Geoff Silk as the World Water Map and Extreme Water Poverty Masterclass received Highly Commended at the 2026 Australian Geography Teachers' Association Awards, in the Geospatial Technology/STEM Geography category. Rez authored the Masterclass, with the support of Yana, Geoff and me as co-authors.
- Awards
- 2026 Australian Geography Teachers' Association Awards
- Category
- Geospatial Technology/STEM Geography
- Work
- World Water Map and Extreme Water Poverty Masterclass
- Authors
- Rez Haremi, with Yana Parsi, Geoff Silk and Dr Samuel Adeoti as co-authors
The Masterclass is built on Essential Need's World Water Map and the Target 6.1 Map, a platform owned by Clean Water for All and used by FairAction to monitor water systems and support their long-term sustainability.
Its section on extreme water poverty draws on FairAction's fieldwork and community projects, taking students beyond theory to see what sustainable water delivery requires in practice.
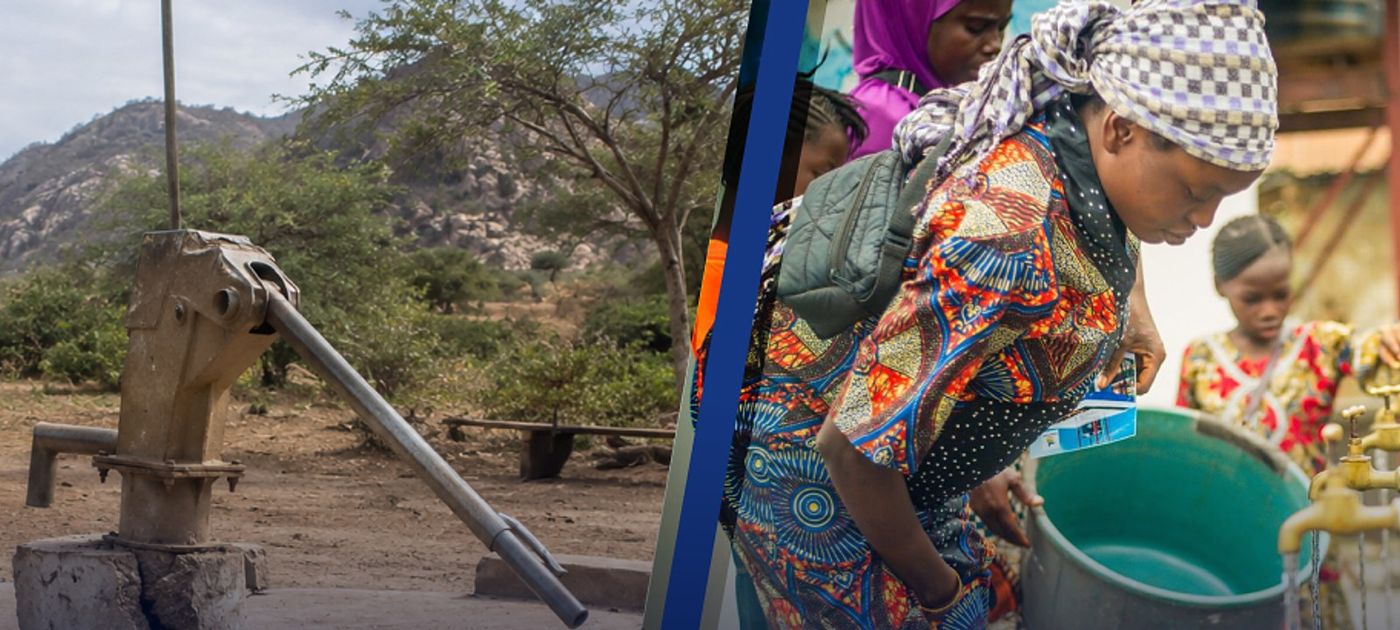
The Masterclass teaches sustainability, and it teaches it through water, because with water the consequence of a solution that is not sustained is concrete and immediate: the pump stops, and people walk back to the source they left.
At any given time, about one in four handpumps in sub-Saharan Africa is not working. In the Nigerian communities mapped by FairAction, about half of the water projects already built have failed. Although sector estimates from the past fifteen years are not directly comparable, they consistently show that non-functionality remains widespread despite new development goals, repeated funding cycles and improved monitoring. A sector can keep building and still lose ground. This article argues that education may be the intervention that lasts longest, and the sections that follow explain why.
When something keeps failing at that scale for that long, the fault is not in the assets. Sustainability is a property of the system around an asset, not of the asset itself, and a system that keeps producing the same result has to change. One of the strongest levers of system change is a paradigm shift: a change in what the people inside the system believe the work is for.
If a paradigm shift is the lever, the question becomes where a new belief about what the work is for can be formed and held. This article argues that education is where that can happen.
The resource you cannot switch away from
In 1972, Limits to Growth modelled what happens when population and consumption keep growing on a finite planet. The pattern it found was overshoot: use grows past what a resource can renew each year, keeps growing for a while on stored reserves, then falls hard once the reserves are gone[1]. Thirty years on, the same authors reported that in a growing number of the world's watersheds the limits had already been passed, and described water as the least substitutable and most essential of resources[2].
What makes water different from every other resource in that model is who pays for substitution. When oil runs short, the world moves to gas, then to sun and wind. When copper runs short, it moves to aluminium. When drinking water runs short it can be substituted only in the sense that it can be moved or made: desalinated, trucked, bottled, treated from a river.
The difference from oil or copper is not that substitution is impossible but where it is paid for. An economy switches fuels at the power station; a household without piped water substitutes at the point of use, by trucking, buying or walking, and pays the premium itself.
So the shortfall is not absorbed by the market. It is carried by whoever has the least capacity to drill deeper, pay more or move away, and most of the people with the least capacity are among the 688.8 million living without even a basic drinking water service, the definition of extreme water poverty[3]. They are without service mostly for reasons of infrastructure and governance, which the rest of this article is about. What overshoot does is make those reasons more expensive to fix.
One case shows the direction of that sorting when two demands meet the same water. In 2023 Uruguay was in its worst drought in seventy years and the authorities were cutting Montevideo's drinking supply with brackish water. In the same months, a planned data centre outside the city carried a design water use of 7.6 million litres a day from the same supply; after public objection, the ministry said the company had withdrawn that design and was working on an alternative that used less water[4].
One case is not a law, and it is not offered as one. The system corrected, which is to its credit. What the case shows is the default: what the design was before anyone objected, and who had to object to change it. Overshoot does not create water poverty on its own. It raises the price of ending it, for the people least able to pay.
The 1972 model was global. The water a hand pump draws is local, from one aquifer under one community. For the argument to hold, the global pattern has to show up at that scale.
Fifty years on, the drawdown is measurable
The global pattern does show up at the local scale. The largest assessment of groundwater ever compiled, covering 1,693 aquifer systems in more than 40 countries, found levels falling in 71 percent of them between 2000 and 2022, and falling faster in many[5]. Groundwater is what rural communities across Africa and Asia depend on, and what a water pump draws from. The monitoring record is thinnest in rural sub-Saharan Africa, so the 71 percent describes the world where measurement exists; for the aquifers under the communities we work in it gives the direction with confidence and the rate with less.
- 36%Falling fast (more than 0.1 m a year)
- 35%Falling
- 29%Stable or rising
This is the climb of the overshoot curve, not the fall; the fall arrives one well at a time, when the pump reaches dry rock. For a rural water point the arithmetic is engineering rather than a citation. Lifting a litre through an extra metre of head costs energy in proportion, a hole has to be drilled to where the water now is, and a well drilled to a depth the water has since left is a dry well.
So every metre the water table falls means a deeper hole, a bigger pump, more energy per litre, and a shorter life for the system. A sector that could once afford to install things that did not last can expect to lose that margin wherever the water table is falling at what the study treats as a rapid rate, more than a tenth of a metre a year, which is 36 percent of measured aquifers, and to see the direction of travel in the seven out of ten that are falling at all.
It is worth being precise about what has and has not been shown so far, because overshoot and infrastructure failure are two different problems and the argument depends on keeping them apart. Overshoot is a resource problem: water is withdrawn faster than it is renewed, and the evidence for it is a falling water table. Infrastructure failure is a delivery problem: a water point is built and stops working, and the evidence for it, in the next section, is a count of pumps that no longer pump. A falling aquifer is one of the recorded causes of failure, but only one; in the catalogue of causes from the Nigerian literature it sits under the environmental heading, and most of the catalogue sits under technical, financial, social, political and institutional ones[6].
Neither problem is water poverty. Water poverty is the condition of the people who sit where the two meet: without service because nothing was built, because what was built has stopped, or because the water under it has gone.
The two problems compound rather than coincide. Overshoot sets the price of each attempt: the depth of the hole, the size of the pump, the energy per litre. Failure sets how many attempts are needed before one lasts. When the price per attempt is rising and the number of attempts is not falling, the cost of ending water poverty rises on both fronts at once, and a sector that can only try with what it can raise has fewer tries left. That is the gap between the two, and it is why the failure rate in the next section cannot be treated as a separate, tolerable inefficiency.
Overshoot
- What happens
- Water is withdrawn faster than it is renewed.
- The evidence
- A falling water table.
- What it sets
- The price of each attempt: the depth of the hole, the size of the pump, the energy per litre.
Infrastructure failure
- What happens
- A water point is built and stops working.
- The evidence
- A count of pumps that no longer pump.
- What it sets
- How many attempts are needed before one lasts.
A failure rate the sector cannot afford
The sector's answer to the 688.8 million people living in water poverty is to build water points. The trouble is that too many stop working. Across sub-Saharan Africa, the first review built on measured data, covering 38 countries, found about one in four handpumps out of action at any given time, with bounds of 22 to 29 percent, and judged its own figure an understatement[7]. Our own research across 1,696 Nigerian communities found that 49.8 percent had no improved water source and only 25.5 percent had a working water pump[8]. In the communities FairAction has mapped, about half of the water projects already built have failed[9].
These are three different measures, not three versions of the same one. The first counts assets: roughly a quarter of handpumps are not working. The second counts projects: about half of those built in our mapped communities have failed. The third counts people: about half of the communities we studied have no improved source at all, whether because nothing was built or because what was built has gone. Together they say one thing about the sector's output. A large share of it is not turning into lasting service. On a falling water table, each failed asset is a hole that has to be drilled again, deeper.
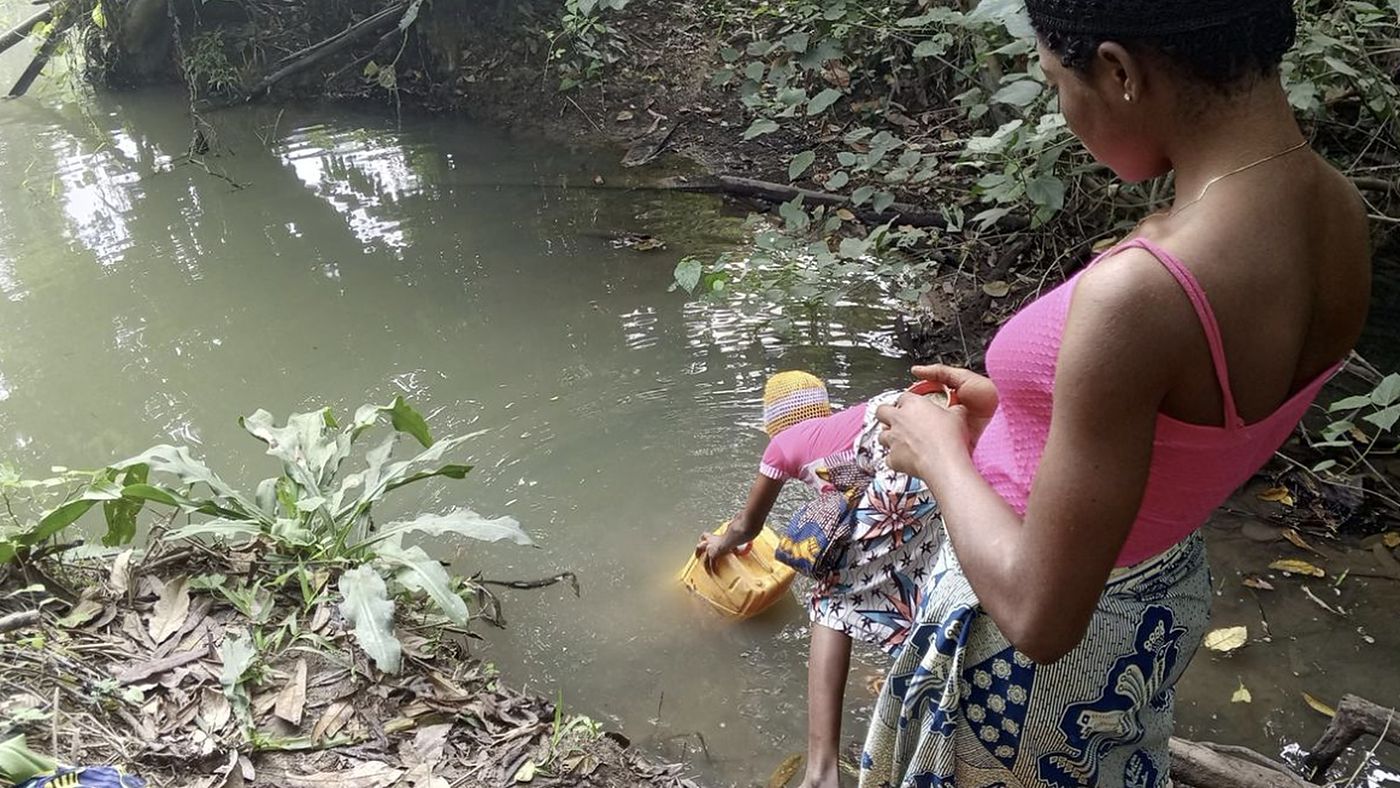
The cost of each failure is not only the hole. A failed water point does not return people to where they started. In the communities we have mapped, the stream a village abandoned when its pump arrived has often grown more contaminated in the years since, so when the pump stops they go back to something worse than they left[9].
Ask a practitioner why a water point fails and the answers come fast: no spare parts, no tariff, no committee, a poorly sited hole, a falling aquifer. Our systematic review of the Nigerian literature catalogued 265 such causes across technical, financial, environmental, social, political and institutional factors[6]. They are all real, and none of them is the root.
- Technical
- Financial
- Environmental
- Social
- Political
- Institutional
What they share is that not one of them is captured by an installation count. An outcome count would show most of them: a functionality or service-level count shows the effect of a missing part or an unpaid tariff within a year. An installation count cannot, by construction, and the installation count is the one the sector's project reporting uses. And in rural water supply the reporting decides the budgets: the sector's structures, systems and effort are geared to the capital phase that the reports count[10]. So a sector that counts installations funds those remedies rarely, late, and never as a result it has to report.
That the sector counts installations is not this article's claim alone. The most thorough review of rural water supply practice to date found that most effort and resources in the sector continue to go into new construction, often at the expense of the sustainability of services already in place; that structures, systems and effort are geared mainly to the capital-intensive phase; and that monitoring needs to move beyond systems built and beneficiaries served[10]. The special issue that followed it described the sector's de facto focus as the provision of hardware for first-time access[11].
The global monitors count service levels[3], but the reports that decide what gets funded count systems built and beneficiaries served, and our own review found post-construction performance to be the stage least planned for and least reported[6]. The handpump functionality figure exists as a separate line of research precisely because no routine reporting captures it[7].
There is a rival explanation worth meeting head on: that funders prefer capital spending to recurrent spending for political reasons, whatever is counted. The same review found exactly that, political forces reinforcing an emphasis on capital investment for financial or political gain[10]. But it found it alongside the counting, not instead of it. A new installation is counted, photographed and reported inside the funding cycle; a repaired one is not, in the reporting that decides budgets, though nothing stops anyone counting it.
The test of it is simple. Put repair, tariff collection and years of continuous service into the results framework and see whether the preference for capital survives. Counting does not compete with spare parts, tariffs or donor politics as an explanation. It sits upstream of all three and decides whether they get a budget. A sector that reports installations builds installations, and it keeps building what it cannot keep working.
One caution belongs here, because the obvious remedy is to fund repair. Repair is not enough on its own, and we learned that the expensive way. After a diagnostic pilot across 204 communities, FairAction began repairing the donor-built boreholes the data flagged. The pumps came back into service and the communities celebrated, and within months the same systems broke again, because a water point built to be counted was never designed to be kept working. Repairing it restores the asset, not the reason it failed.
In 2020 we stopped repairing and started designing infrastructure to last from the first day[12]. That is the same lesson from the other side: as long as installations are built to be counted, money spent repairing them may buy a few months of service and then be lost, so changing what is counted comes before, not instead of, funding repair.
If building more does not fix this, what does?
Where the leverage is
Donella Meadows, lead author of Limits to Growth, spent the rest of her career asking where to push on a system to change what it produces. Her answer is a ladder of leverage points, from weakest to strongest[13].
- The paradigmTop step
The shared idea of what water work is for.
Where education can act - The goalSecond step
The result a system is built to produce. In project reporting, still the number of water points installed.
- Information and rulesMiddle steps
The information a sector sees and the rules it builds by. Fast levers, and they matter.
- Budgets, targets, installationsBottom steps
The ones the water sector reaches for first. Push on them and the system absorbs the push and carries on.
The bottom steps are the ones the water sector reaches for first: bigger budgets, new targets, more installations. They are the weakest. Push on them and the system absorbs the push and carries on.
The top two steps decide everything beneath them. The goal is the result a system is built to produce, and in the project reporting that steers most of the sector's money, that goal is still the number of water points installed[10]. Meadows called this seeking the wrong goal[14]. A system does not produce what we hope for. It produces what it is funded, measured and rewarded to produce. Count installations and you get installations. The failure rates above are consistent with that.
Why would a sector count that? Because a count is a choice, and people choose to count what they believe the work is for. The review above noted that the idea of a water service is not commonly used in rural water supply at all; most reference is to the capital-intensive project period only[10]. A sector with no working word for the service is a sector that believes the job is the project, and a sector that believed its job was water still flowing in year ten would find the installation count as strange as a hospital counting admissions and never discharges.
Above the goal sits the paradigm, the shared idea of what water work is for. If the sector believed its job was water that keeps flowing, the goal would change, and the rules, information systems and budgets would follow.
The steps in the middle of that ladder, changing the information a sector sees and the rules it builds by, can be acted on now, and we act on them. The Target 6.1 Map changes the information flow[15]. It does not record a water point as a dot with a status. It records a community:
Our most recent mapping holds up to 400 data points for a single community, depending on how many sources it has, and from them the community is assessed against Target 6.1, from achieved to extreme water poverty. That is what it takes to understand a community's challenge in its own context, and to record the warning signs, such as a system that is working but vulnerable, before it fails rather than after. The predictive model changes the rule about what gets built. Publishing the results changes what the sector counts as evidence. Those are fast levers and they matter.
The sector has pulled an information lever before, and the comparison is instructive because of the difference. The Water Point Data Exchange, opened in 2015, gathered water point records from across the sector into one place: location, type, status. It made failures visible to people who still counted installations, and the failure rate that followed is in Figure 3 below. An information lever changes the picture in front of a sector, not the goal it reports against, and while the goal stays the same the picture is absorbed. The Target 6.1 Map was built for a different purpose, to monitor and sustain each solution in the context of its community, but it is still information, and information on its own does not change a goal. That is why the rest of this section is about the goal.
But the sector has been pulling fast levers for a long time. In 2009, the rural water sector's own network estimated that about one in three handpumps in sub-Saharan Africa was not working[16]. Then came the Sanitation and Water for All partnership in 2010, the move from the MDG water target to SDG 6.1 in 2015, which changed what the global monitor measures but not what project reports count[3, 10], and the Water Point Data Exchange, opened the same year. When the measured data were compiled, the share for 2015 came out at about one in four, and the authors judged even that an understatement[7]. National studies since then report about one in three[17]. Fifteen years of levers, and every available estimate still falls between a quarter and a third; the methods differ too much to show a trend, but none shows the improvement the levers were meant to produce.
- 2009About one in three handpumps not working, estimated by the rural water sector's own network [16]
- 2010Sanitation and Water for All partnership
- 2015Move from the MDG water target to SDG 6.1 [3, 10]
- 2015Water Point Data Exchange opened
- 2015About one in four in the measured data, judged an understatement by its authors [7]
- SinceAbout one in three in national studies [17]
Fifteen years of levers pulled around the same failure rate leave a question: why did the one that mattered stay untouched? The record points to an answer.
The lever that was never pulled is changing what the budget reports count.
The global monitor changed what it measures in 2015; project reporting did not[3, 10]. The rival explanations for the unchanged range each lead back to the count: installation outpaced repair because repair is what an installation count leaves out; functionality was measured by different methods, and they all land in the same range; and funders prefer capital spending because capital is what the count rewards.
Changing the goal has not been tried at the scale that would test it.
Results-based and service-level frameworks exist, but the project reporting that decides most budgets still counts systems built and beneficiaries served[10]. So the range the estimates sit in is not evidence against counting service instead of installations; the levers that were pulled were the ones around the goal. A sector that changes everything except its goal is what a paradigm problem looks like from the outside.
How a paradigm is changed, according to Meadows[13].
A paradigm is the shared belief about what the work is for, so changing it means changing what people believe. Meadows describes how: show people, again and again, the failures their current belief cannot explain; argue openly and confidently for the new belief; and move people who already hold the new belief into visible positions of influence, so that in time they outnumber those who hold the old one. All of this is aimed at adults who already believe something about the work. The first two methods try to change their minds; the third replaces them, and replacing a sector's decision-makers takes a generation.
Education is a way Meadows did not list.
A student's attitude to science may be set by Year 10, but a student holds no belief yet about what water work is for, so there is nothing to argue against and nobody to replace. They meet the failures first, in the record of real communities, before an installation count has had a chance to look normal. A student who meets the Masterclass this year will be signing off procurement in the 2040s, which is slow, but so is placing people in positions of power, and nothing started later arrives sooner.
Two objections, answered.
Reporting templates could be rewritten this year: yes, and they should be, now. But a template outlives the person who wrote it. The people who inherit it, in the next funding round or the next government, were trained in the same sector, and if they still believe the job is installations they can set the new measure aside as quietly as it arrived. Education is what may stop the next generation writing the old rule back. Engineers are formed at university, not school: yes, and both are needed, but a school geography class reaches the future officials, funders, journalists and voters who will decide what the engineers are paid to count.
That is a lot of weight to put on education, and two questions follow from it. Does education change what people do, or only what they know? And where does the knowledge it teaches come from? The first has an answer in the research. The second is the work this newsletter is named for.
Does education change what people do?
Among primary students in grades 4 to 6 at five Berlin schools, taking part in nature-based environmental education was associated with more sustainable behaviour. What carried the association was not facts. Feeling connected to nature explained 69 percent of the variation in behaviour; environmental knowledge on its own explained 2 percent[18]. The study measured association, not cause, and says so.
So the answer the evidence allows is a qualified yes: knowledge went with behaviour when it came with a connection to a place, and barely at all on its own. That is why FairAction's education work starts from named communities and the record of what happened to their water, rather than from statistics.
A second study shows how far the change reaches. A controlled trial in the Seychelles gave children wetland education and then surveyed their parents. The parents showed greater knowledge and reported better household water management than parents whose children had not taken part[19]. The effect left the classroom at once and changed what a household did with its water.
Where does the knowledge come from?
Education teaches whatever it is given. If it is given the sector's own project reports, it will teach that installations are the work, because installations are what those reports count. So before a failure can be put in front of a student, somebody has to establish what failed and why, in a way that does not depend on the reporting that counted it as a success.
That is what designing for sustainability means at FairAction: understanding why solutions fail and what makes them last before anything is built, and then sharing that understanding so that it can be held by others. The work has four parts, and each feeds the next.
Iterative research
FairAction's research runs as a cycle (how we work). Communities are mapped and their context recorded; a predictive model assesses each one against the 265 known sustainability challenges and says whether a solution will last and what must be in place first; the solution is designed, piloted and built; and once it is running, more than sixteen metrics are tracked continuously, so that what the infrastructure does in use feeds back into the research and the design of the next one. Every project teaches the next. This is where the knowledge of why water points fail, and what makes a solution last, comes from.
Validation and publication
The findings are published through peer review with the University of Technology Sydney, so that the methods and conclusions are examined by people with no stake in the result; the studies are listed on the FairAction research and publications page[20]. Peer review is what allows field experience to be treated as evidence by a lecturer, a funder or a ministry, and it is the step the sector's own reporting skips.
Knowledge sharing
The evidence is then put where the people deciding now can use it: this newsletter, the education pages and digital tools at fairaction.ngo, and the Target 6.1 Map, which shows what the data say about each community rather than what a project report says about an installation. This article is part of that work.
Education partnerships
The same evidence is carried into teaching by partners who know how to teach it, as the Masterclass with Essential Need does for school students, while the published studies put it in front of researchers and scholars. This is where a belief about what the work is for can be formed before it has to be changed.
Iterative research produces the knowledge. Publication makes it trustworthy. Sharing and education put it in front of the people deciding now, and teaching it in a classroom puts it in front of the people who will decide next. It is one body of knowledge, and the paradigm the sector runs on is held by all of them.
Conclusion
Groundwater is being drawn down. About one in four handpumps across sub-Saharan Africa is not working at any given time, while about half of the water projects in the Nigerian communities mapped by FairAction have failed. The sector keeps building what it cannot keep working because its reporting counts installations, and it counts installations because its people believe that is the work.
Changing what is counted is the decisive change, and it should be made now. But a goal changed by people who still hold the old belief may not hold. The belief has to change too, and a belief is formed by what a person learns before they decide.
That is what designing for sustainability means in practice: establishing why solutions fail and what makes them last, validating it, publishing it, sharing it with the people deciding now, and teaching it to the people who will decide next. Those who learn early what makes a solution last may become the leaders in sustainable solutions in the years to come.
Sustainability is learned before it is built.
If you fund water work, deliver it, teach it or study it, follow FairAction on LinkedIn to receive each article as it is published. The field results, the published studies and the Target 6.1 Map are at fairaction.ngo, and the research behind this article is on the research and publications page.
References
- 1Meadows, D. H., Meadows, D. L., Randers, J. & Behrens, W. W. (1972). The Limits to Growth. Universe Books.
- 2Meadows, D. H., Randers, J. & Meadows, D. L. (2004). Limits to Growth: The 30-Year Update. Chelsea Green Publishing.
- 3WHO/UNICEF Joint Monitoring Programme (2025). Progress on household drinking water, sanitation and hygiene 2000-2024: special focus on inequalities. washdata.org/reports/jmp-2025-wash-households
- 4Feliba, D. (2023). In Latin America, data center plans fuel water worries. Context (Thomson Reuters Foundation), 26 September 2023. context.news/big-tech/in-latin-america-data-center-plans-fuel-water-worries
- 5Jasechko, S., Seybold, H., Perrone, D., Fan, Y., Shamsudduha, M., Taylor, R. G., Fallatah, O. & Kirchner, J. W. (2024). Rapid groundwater decline and some cases of recovery in aquifers globally. Nature, 625, 715-721. doi.org/10.1038/s41586-023-06879-8
- 6Adeoti, O. S., Kandasamy, J. & Vigneswaran, S. (2023). Water infrastructure sustainability in Nigeria: a systematic review of challenges and sustainable solutions. Water Policy, 25(11), 1094-1111. doi.org/10.2166/wp.2023.173
- 7Foster, T., Furey, S., Banks, B. & Willetts, J. (2020). Functionality of handpump water supplies: a review of data from sub-Saharan Africa and the Asia-Pacific region. International Journal of Water Resources Development, 36(5), 855-869. doi.org/10.1080/07900627.2018.1543117
- 8Adeoti, O. S., Kandasamy, J. & Vigneswaran, S. (2024). Water infrastructure sustainability challenge in Nigeria: a detailed examination of infrastructure failures and potential solutions. Water Supply, 24(6), 2066-2076. doi.org/10.2166/ws.2024.127
- 9FairAction International. The global water crisis, and why it persists. fairaction.ngo/education-and-research/the-crisis
- 10Lockwood, H. & Smits, S. (2011). Supporting Rural Water Supply: Moving Towards a Service Delivery Approach. Rugby: Practical Action Publishing, for IRC and Aguaconsult. ircwash.org/sites/default/files/Lockwood-2011-Supporting.pdf
- 11Moriarty, P., Smits, S., Butterworth, J. & Franceys, R. (2013). Trends in rural water supply: towards a service delivery approach. Water Alternatives, 6(3), 329-349.
- 12FairAction International. Our history. fairaction.ngo/about/our-history
- 13Meadows, D. H. (1999). Leverage Points: Places to Intervene in a System. The Sustainability Institute.
- 14Meadows, D. H. (2008). Thinking in Systems: A Primer. White River Junction, VT: Chelsea Green Publishing.
- 15FairAction International. The Target 6.1 Map. fairaction.ngo/education-and-research/target-6-1-map-digital-tools
- 16Rural Water Supply Network (2009). Handpump data, selected countries in sub-Saharan Africa. St Gallen: RWSN.
- 17Mvongo, V. D. (2024). The presence of a handpump does not mean that people have access to reliable and sustainable water services. Rural Water Supply Network blog, 9 January 2024. Reporting Deal, P. & Furey, S. (2019) and Mvongo, V. D., Defo, C. & Tchoffo, F. (2023). rwsn.blog/2024/01/09/the-presence-of-a-handpump
- 18Otto, S. & Pensini, P. (2017). Nature-based environmental education of children: environmental knowledge and connectedness to nature, together, are related to ecological behaviour. Global Environmental Change, 47, 88-94. doi.org/10.1016/j.gloenvcha.2017.09.009
- 19Damerell, P., Howe, C. & Milner-Gulland, E. J. (2013). Child-orientated environmental education influences adult knowledge and household behaviour. Environmental Research Letters, 8(1), 015016. doi.org/10.1088/1748-9326/8/1/015016
- 20FairAction International. Research and publications. fairaction.ngo/education-and-research/research-publications